Analyses and Reports – Two Levels of Insights
Purpose
Reports: “Helicopter view” – Quick overview and comparisons (the entire landscape)
Analyses: “Microscope” – Deeper understanding and root-cause analysis (zoom in)
Key Question
Reports = What is happening?
Example: “Sales are declining.”
Analyses = Why is it happening?
Example: “The decline is mainly driven by Customer X and Product Y.”
Content
Reports: Index figures, KPIs, comparisons between sales representatives and chains
Analyses: Detailed views by customer, product, or time period – the analyses are dynamic, enabling exploration and drill-down
Usage
Reports: Follow-up, ranking, identifying trends
Analyses: Explain changes, identify underlying causes
Together, these create a complete picture: from patterns to action
Target Group
They are used by both sales management and sales representatives – however, analyses are more likely to be used by sales management to identify performance, track development over time, and analyze underlying causes.
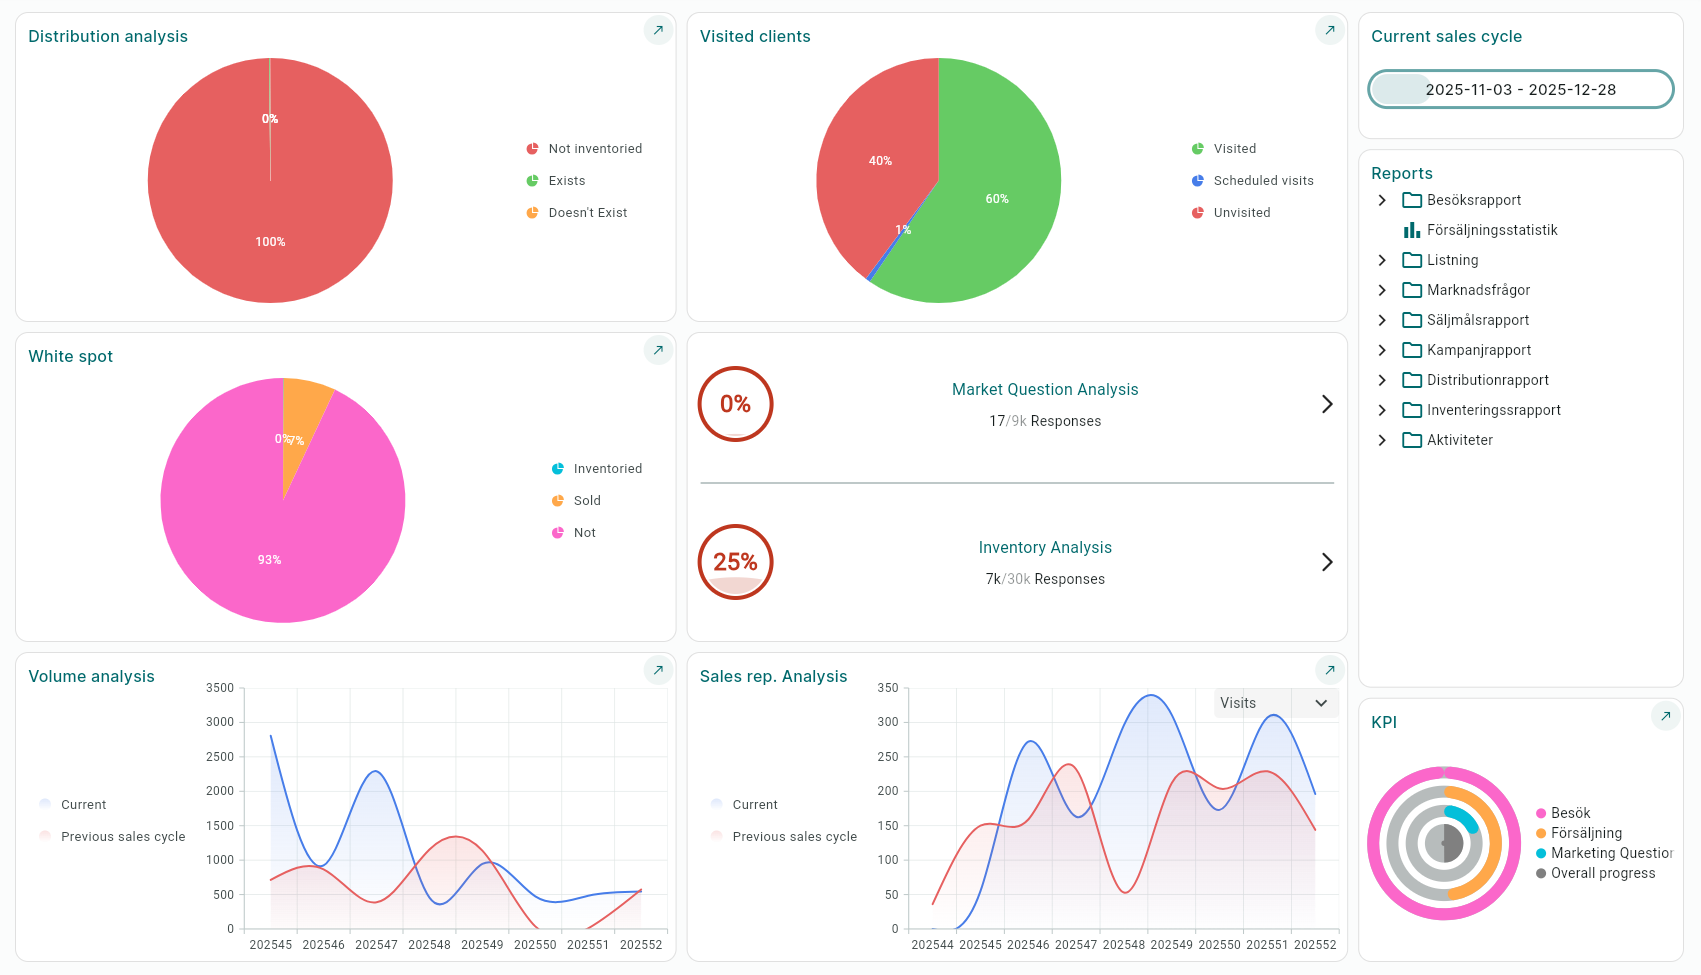
The Following Dynamic Analyses Are Available:
Distribution Analysis – Provides an overview of how much of your assortment is available on the shelf.
Visited Customers – Shows the number of completed visits out of the total visit quota
(Number of customers × specified visit frequency).Volume Analysis – Shows order volume for the current sales cycle compared to the previous sales cycle.
District Analysis – Can be filtered by visits or orders and compared to the previous sales cycle.
Market Question Analysis – Shows the proportion of market questions that have been answered.
Inventory Analysis – Shows the proportion of inventory orders that have been answered.
White Spot Analysis – Identifies parts of your assortment that lack distribution points.
In addition to the dynamic analyses, the following ready-made reports are also available:
Visited Reports
• Number of visits per district
• Number of visits per profile
Sales Statistics
Market Questions
• Market questions per district
Sales Target Report
• Budget/Outcome campaign salesperson
• Budget/Outcome campaign main salesperson
• Outcome campaign salesperson
Campaign Report – (For outcome to be displayed, the salesperson must have placed an order via the campaign)
• Budget/Outcome campaign salesperson
• Budget/Outcome campaign main salesperson
• Outcome campaign salesperson
Distribution Report
• Not listed
• Not inventoried
• Chain
• Chain/District
• District/Product
• Chain/Product
Inventory Report
• District
• District/Product
• District/Chain
Activities
• Per district
• Charts
Was this article helpful?
That’s Great!
Thank you for your feedback
Sorry! We couldn't be helpful
Thank you for your feedback
Feedback sent
We appreciate your effort and will try to fix the article