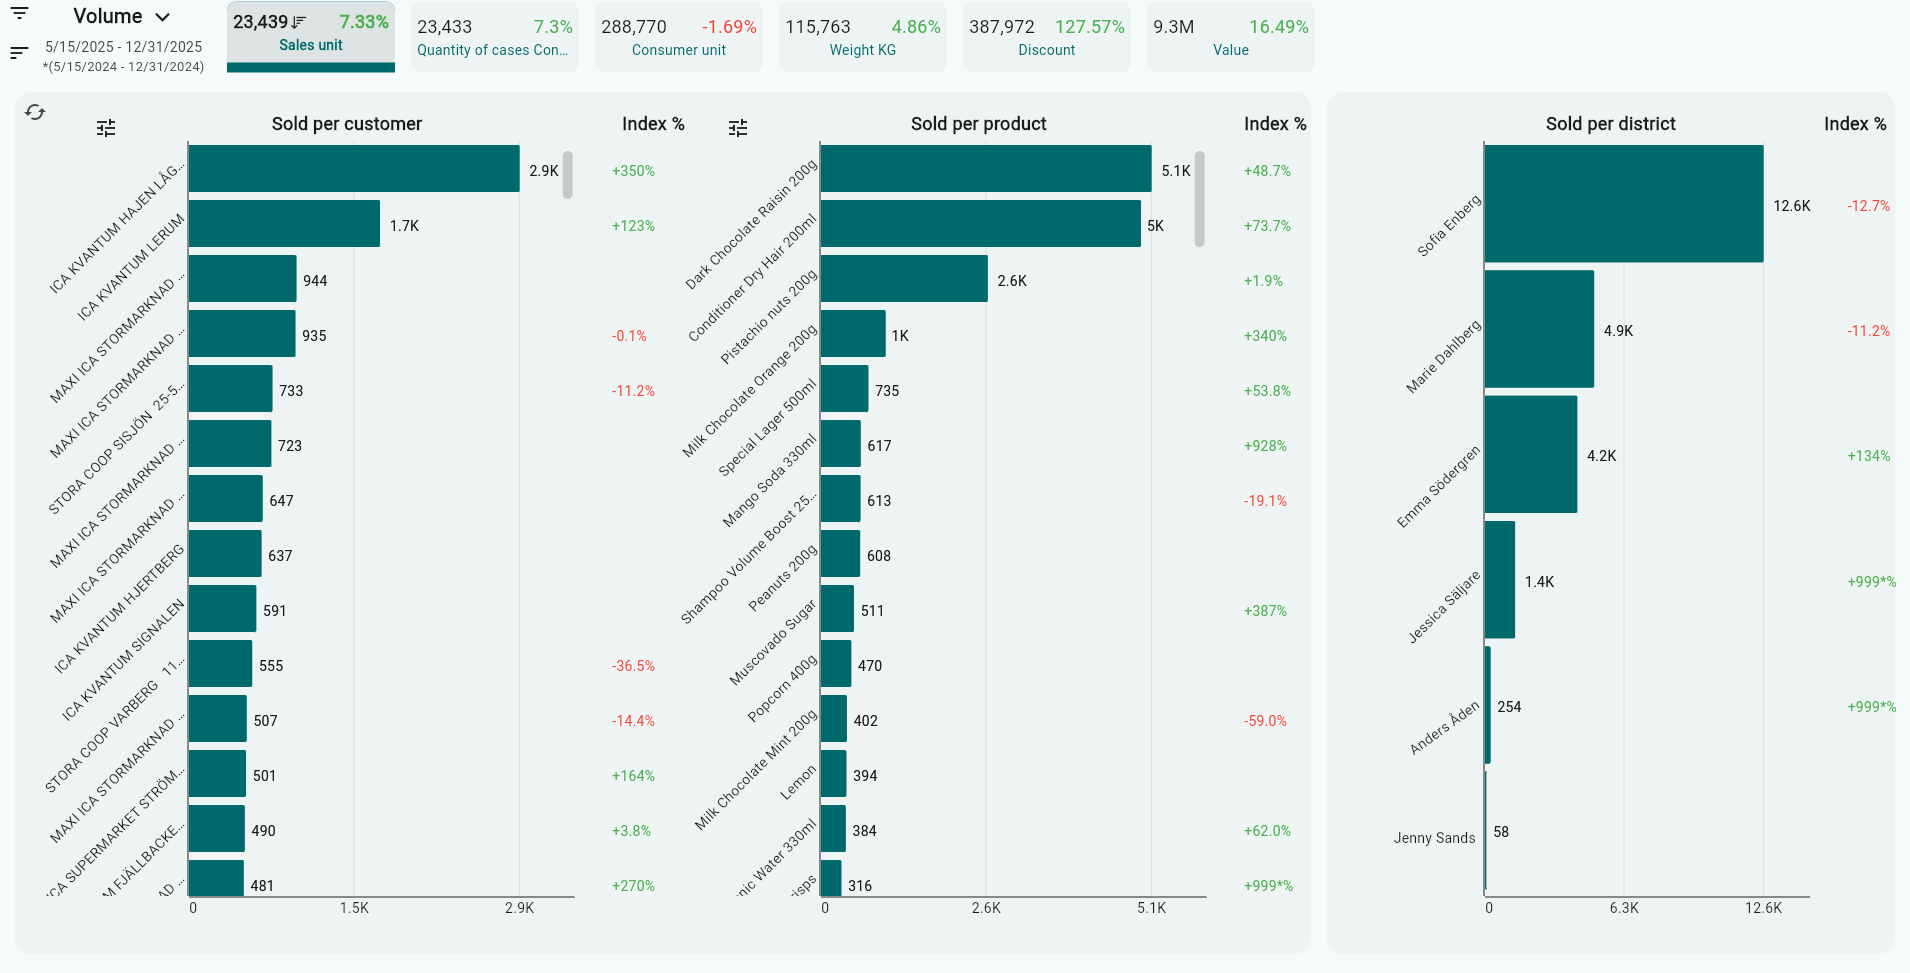
Shows the volume of products sold, expressed in thousands, for the selected period per product group and chain, as well as a total summary per district.
The analysis displays a summary of quantities given in Sales Units (CRT), Converted CRT Quantity (Display units converted to cartons), Consumer Units (pcs), and Weight in KG.
Filtering options:
- Order date from and to
- Delivery date from and to
- Product groups
- Products
- Chain
- Customer classes
- Sales force
If you select Comparison, the chosen unit is displayed graphically alongside the corresponding period of the previous year.
Select the unit you want the graph to display by checking the box.
(Sales Units (CRT), Converted CRT Quantity (Display units converted to cartons), Consumer Units (pcs), and Weight in KG)


Was this article helpful?
That’s Great!
Thank you for your feedback
Sorry! We couldn't be helpful
Thank you for your feedback
Feedback sent
We appreciate your effort and will try to fix the article