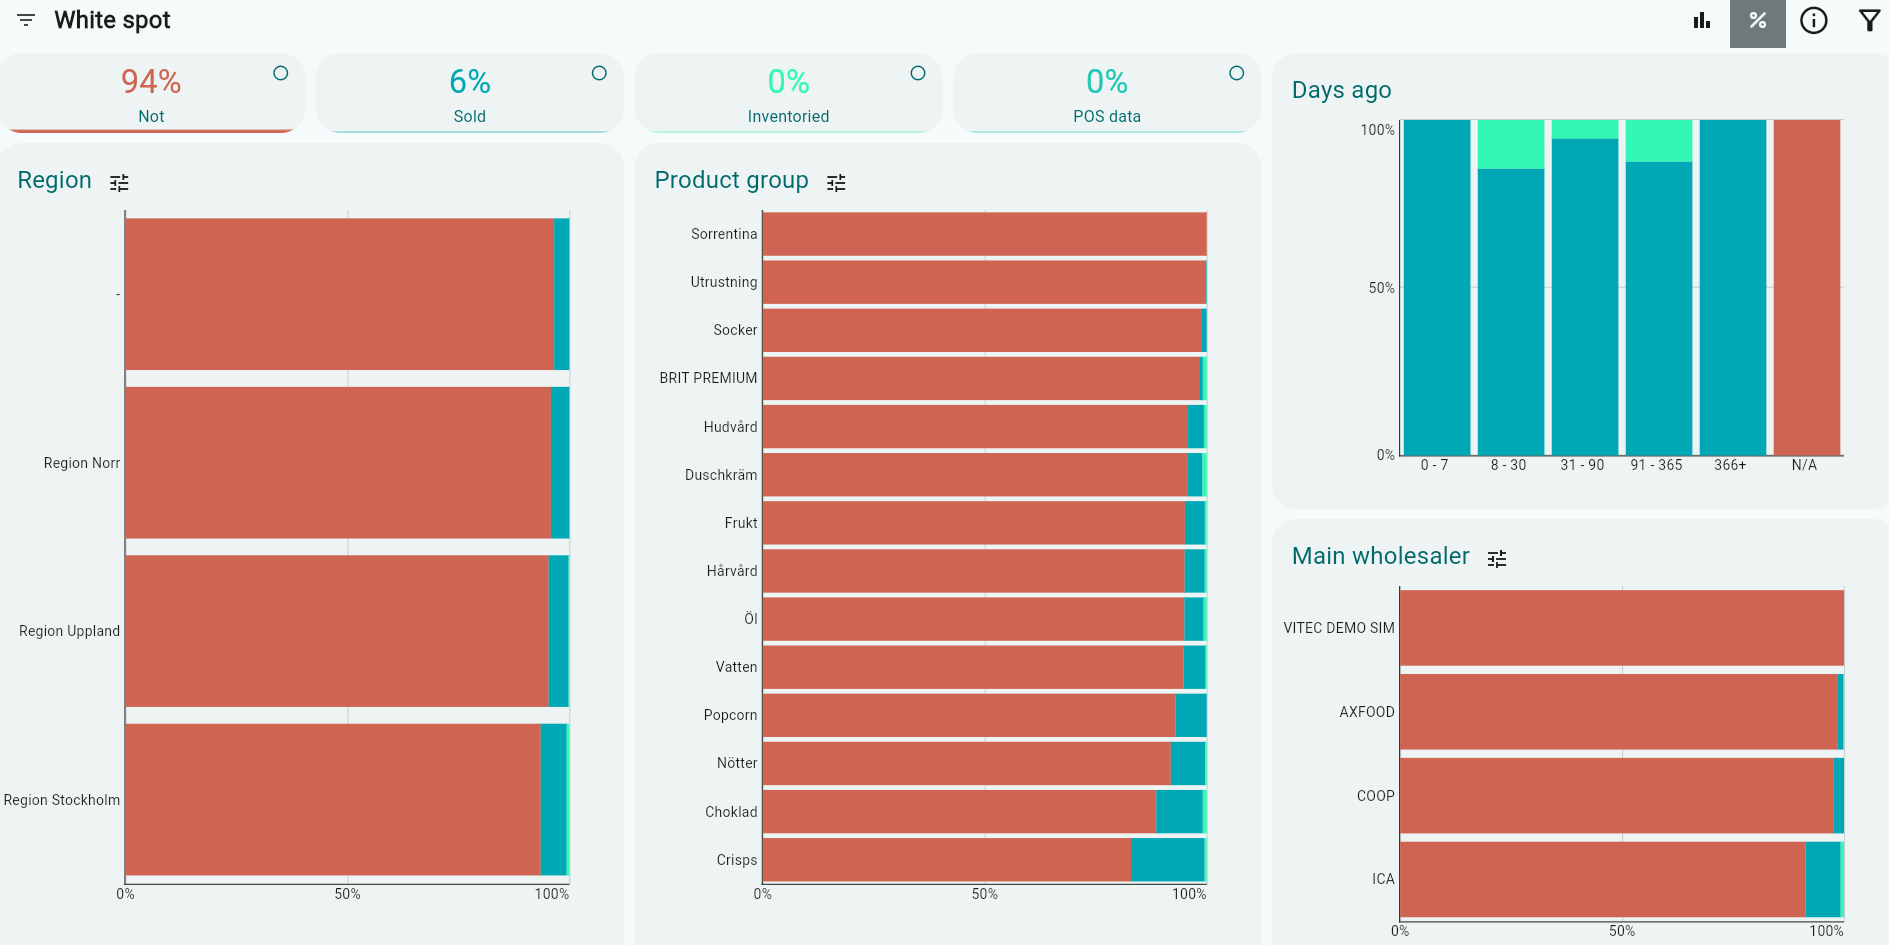
Get a clear overview of where you lack distribution.
The analysis includes orders, inventory orders, listings, and POS data.
The total percentage adds up to 100% and is based on the distribution:
Order
Inventoried
Purchased (POS data)
None
None: There is no order history, inventory, listing, or POS data recorded during the date range.
Sold: Shows orders placed during the period.
Inventoried: Shows listings registered either in listing or inventory order during the period.
Purchased: Shows POS data during the period.
The analysis only includes active customers and active articles that do not have listing status X.
It is divided by Region, Product Group, and Chain, as well as by the time period since the last registration.
Filtering options:
- Type – Filter option for product group and subgroups within the product group (group 1, 2, and 3) to see where there is no sales at all.
- Order date from and to
- Delivery date from and to
- Products
- Chain
- Customer Classes
- Article Status
- Sales Force
Was this article helpful?
That’s Great!
Thank you for your feedback
Sorry! We couldn't be helpful
Thank you for your feedback
Feedback sent
We appreciate your effort and will try to fix the article